
| GAI Operations History | |
|---|---|
| Year | Operations |
| 2023 | 69,308 |
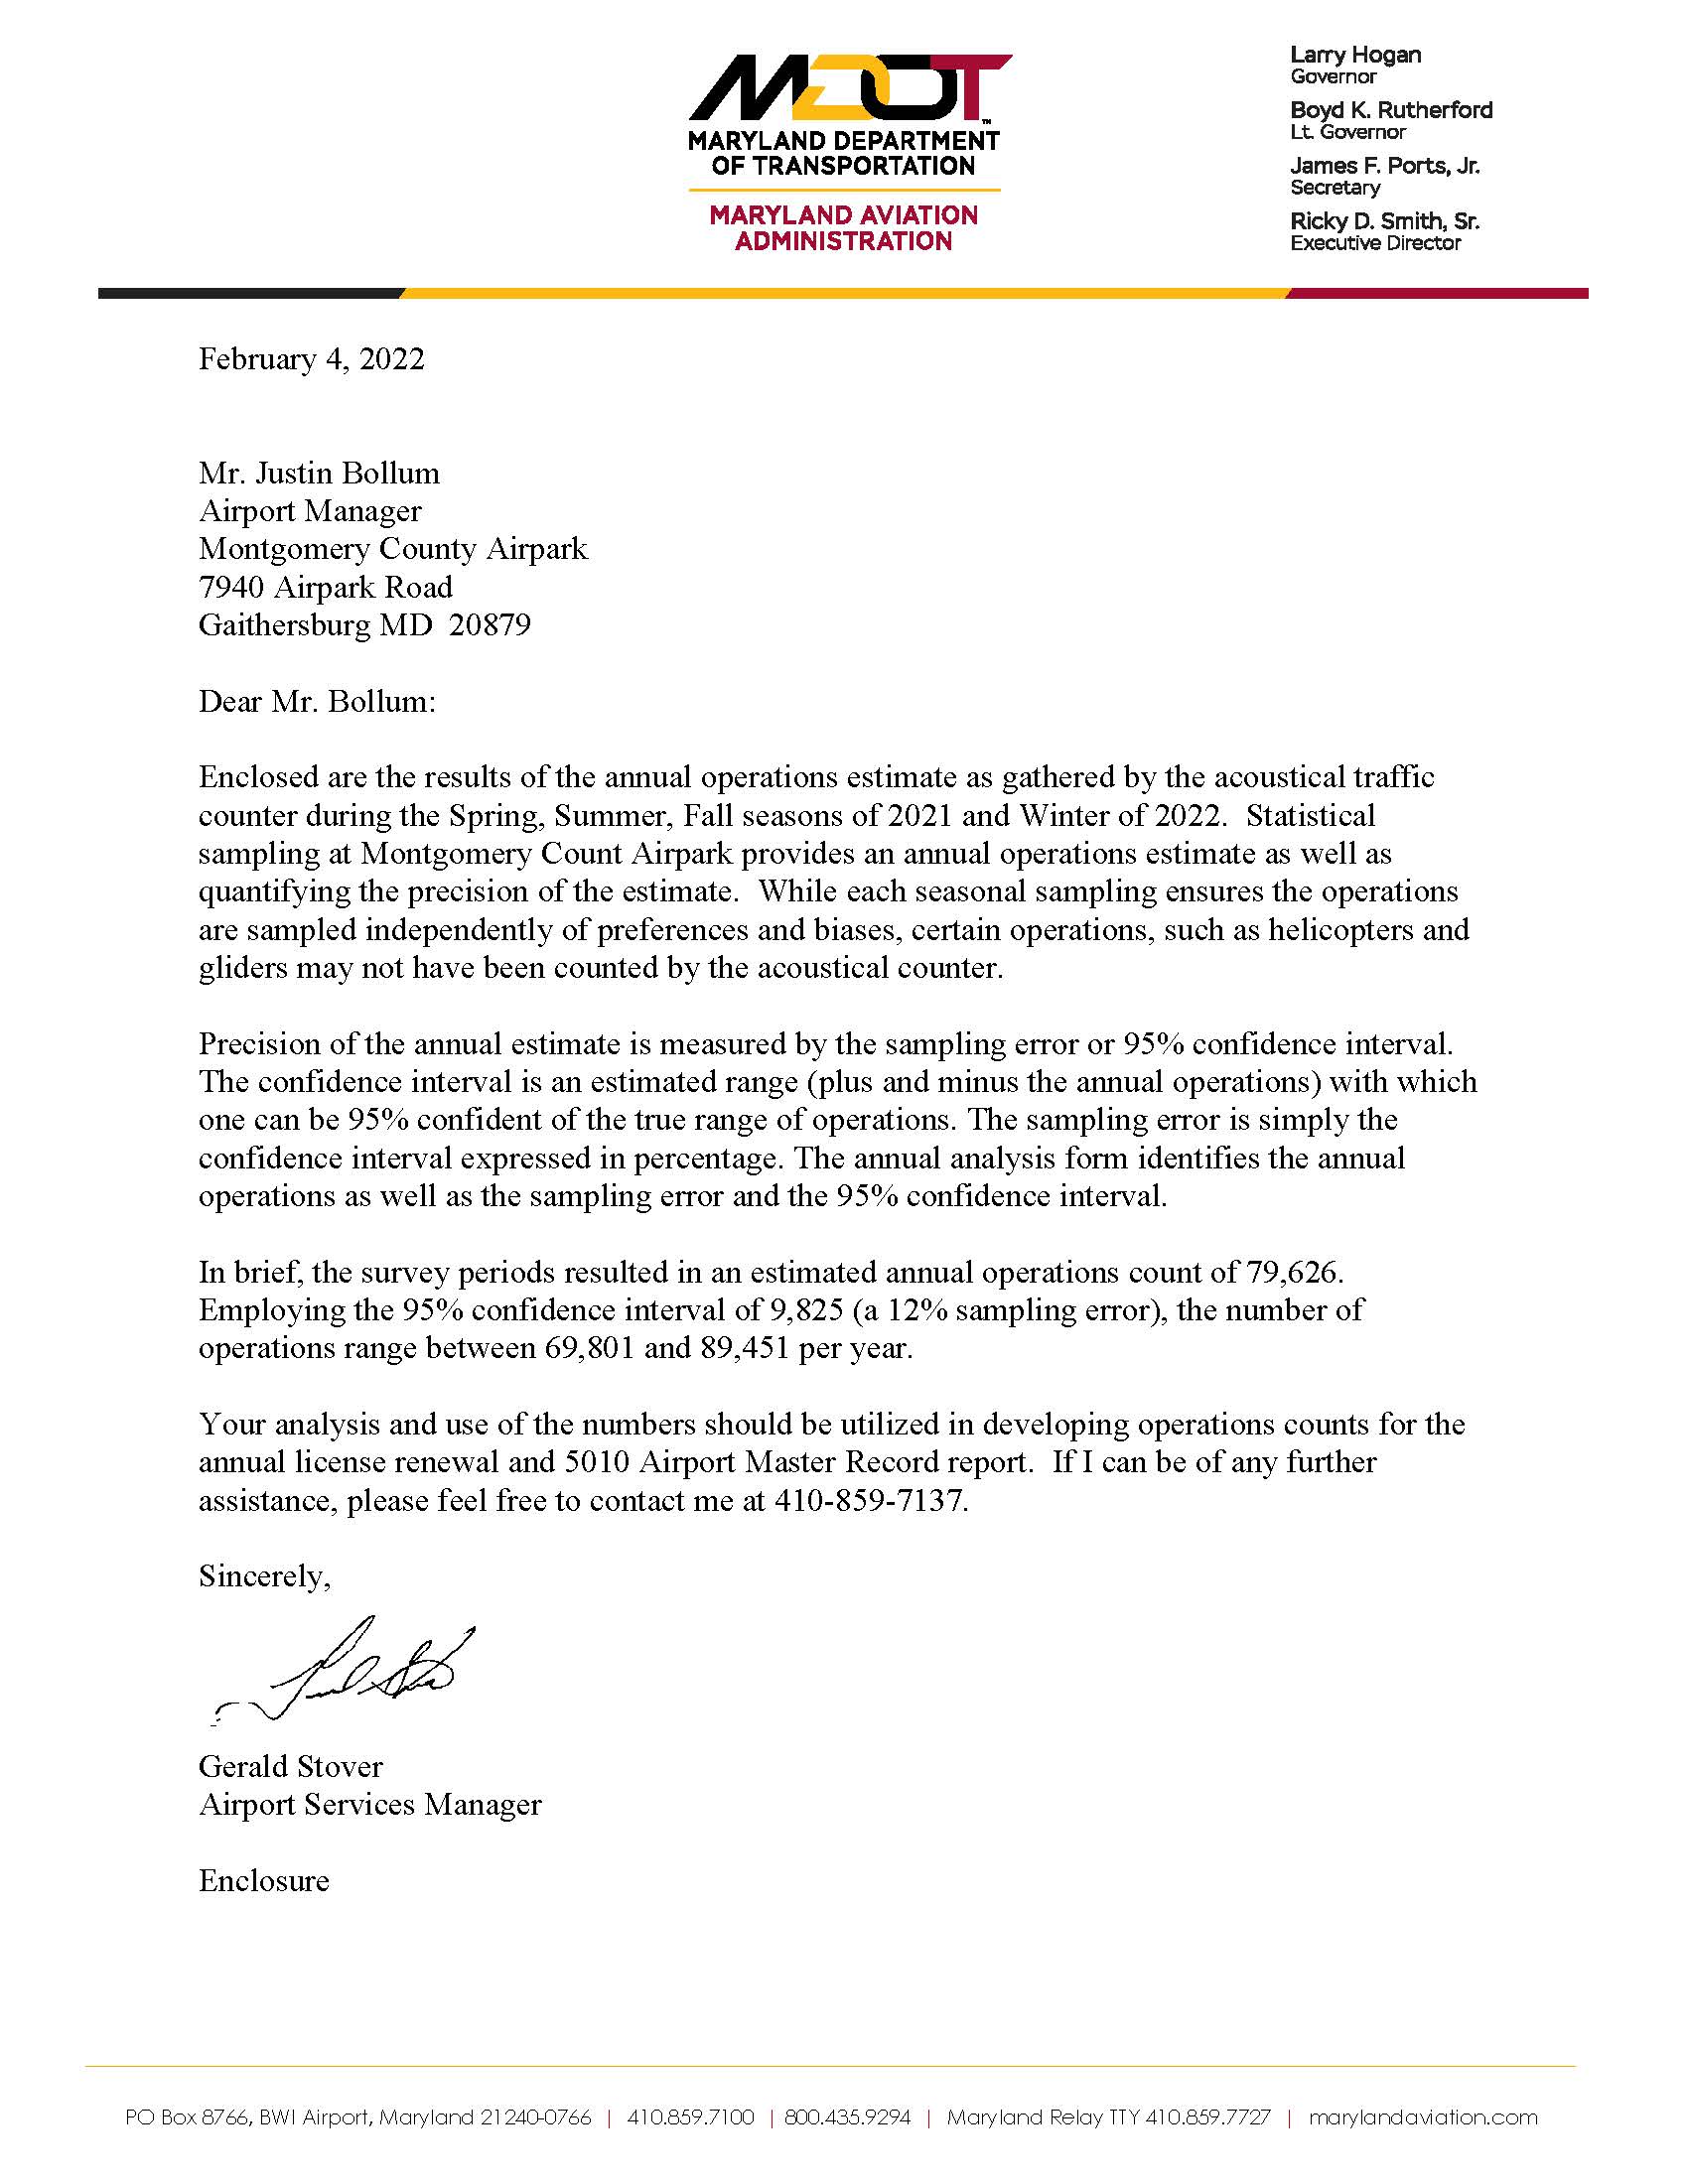
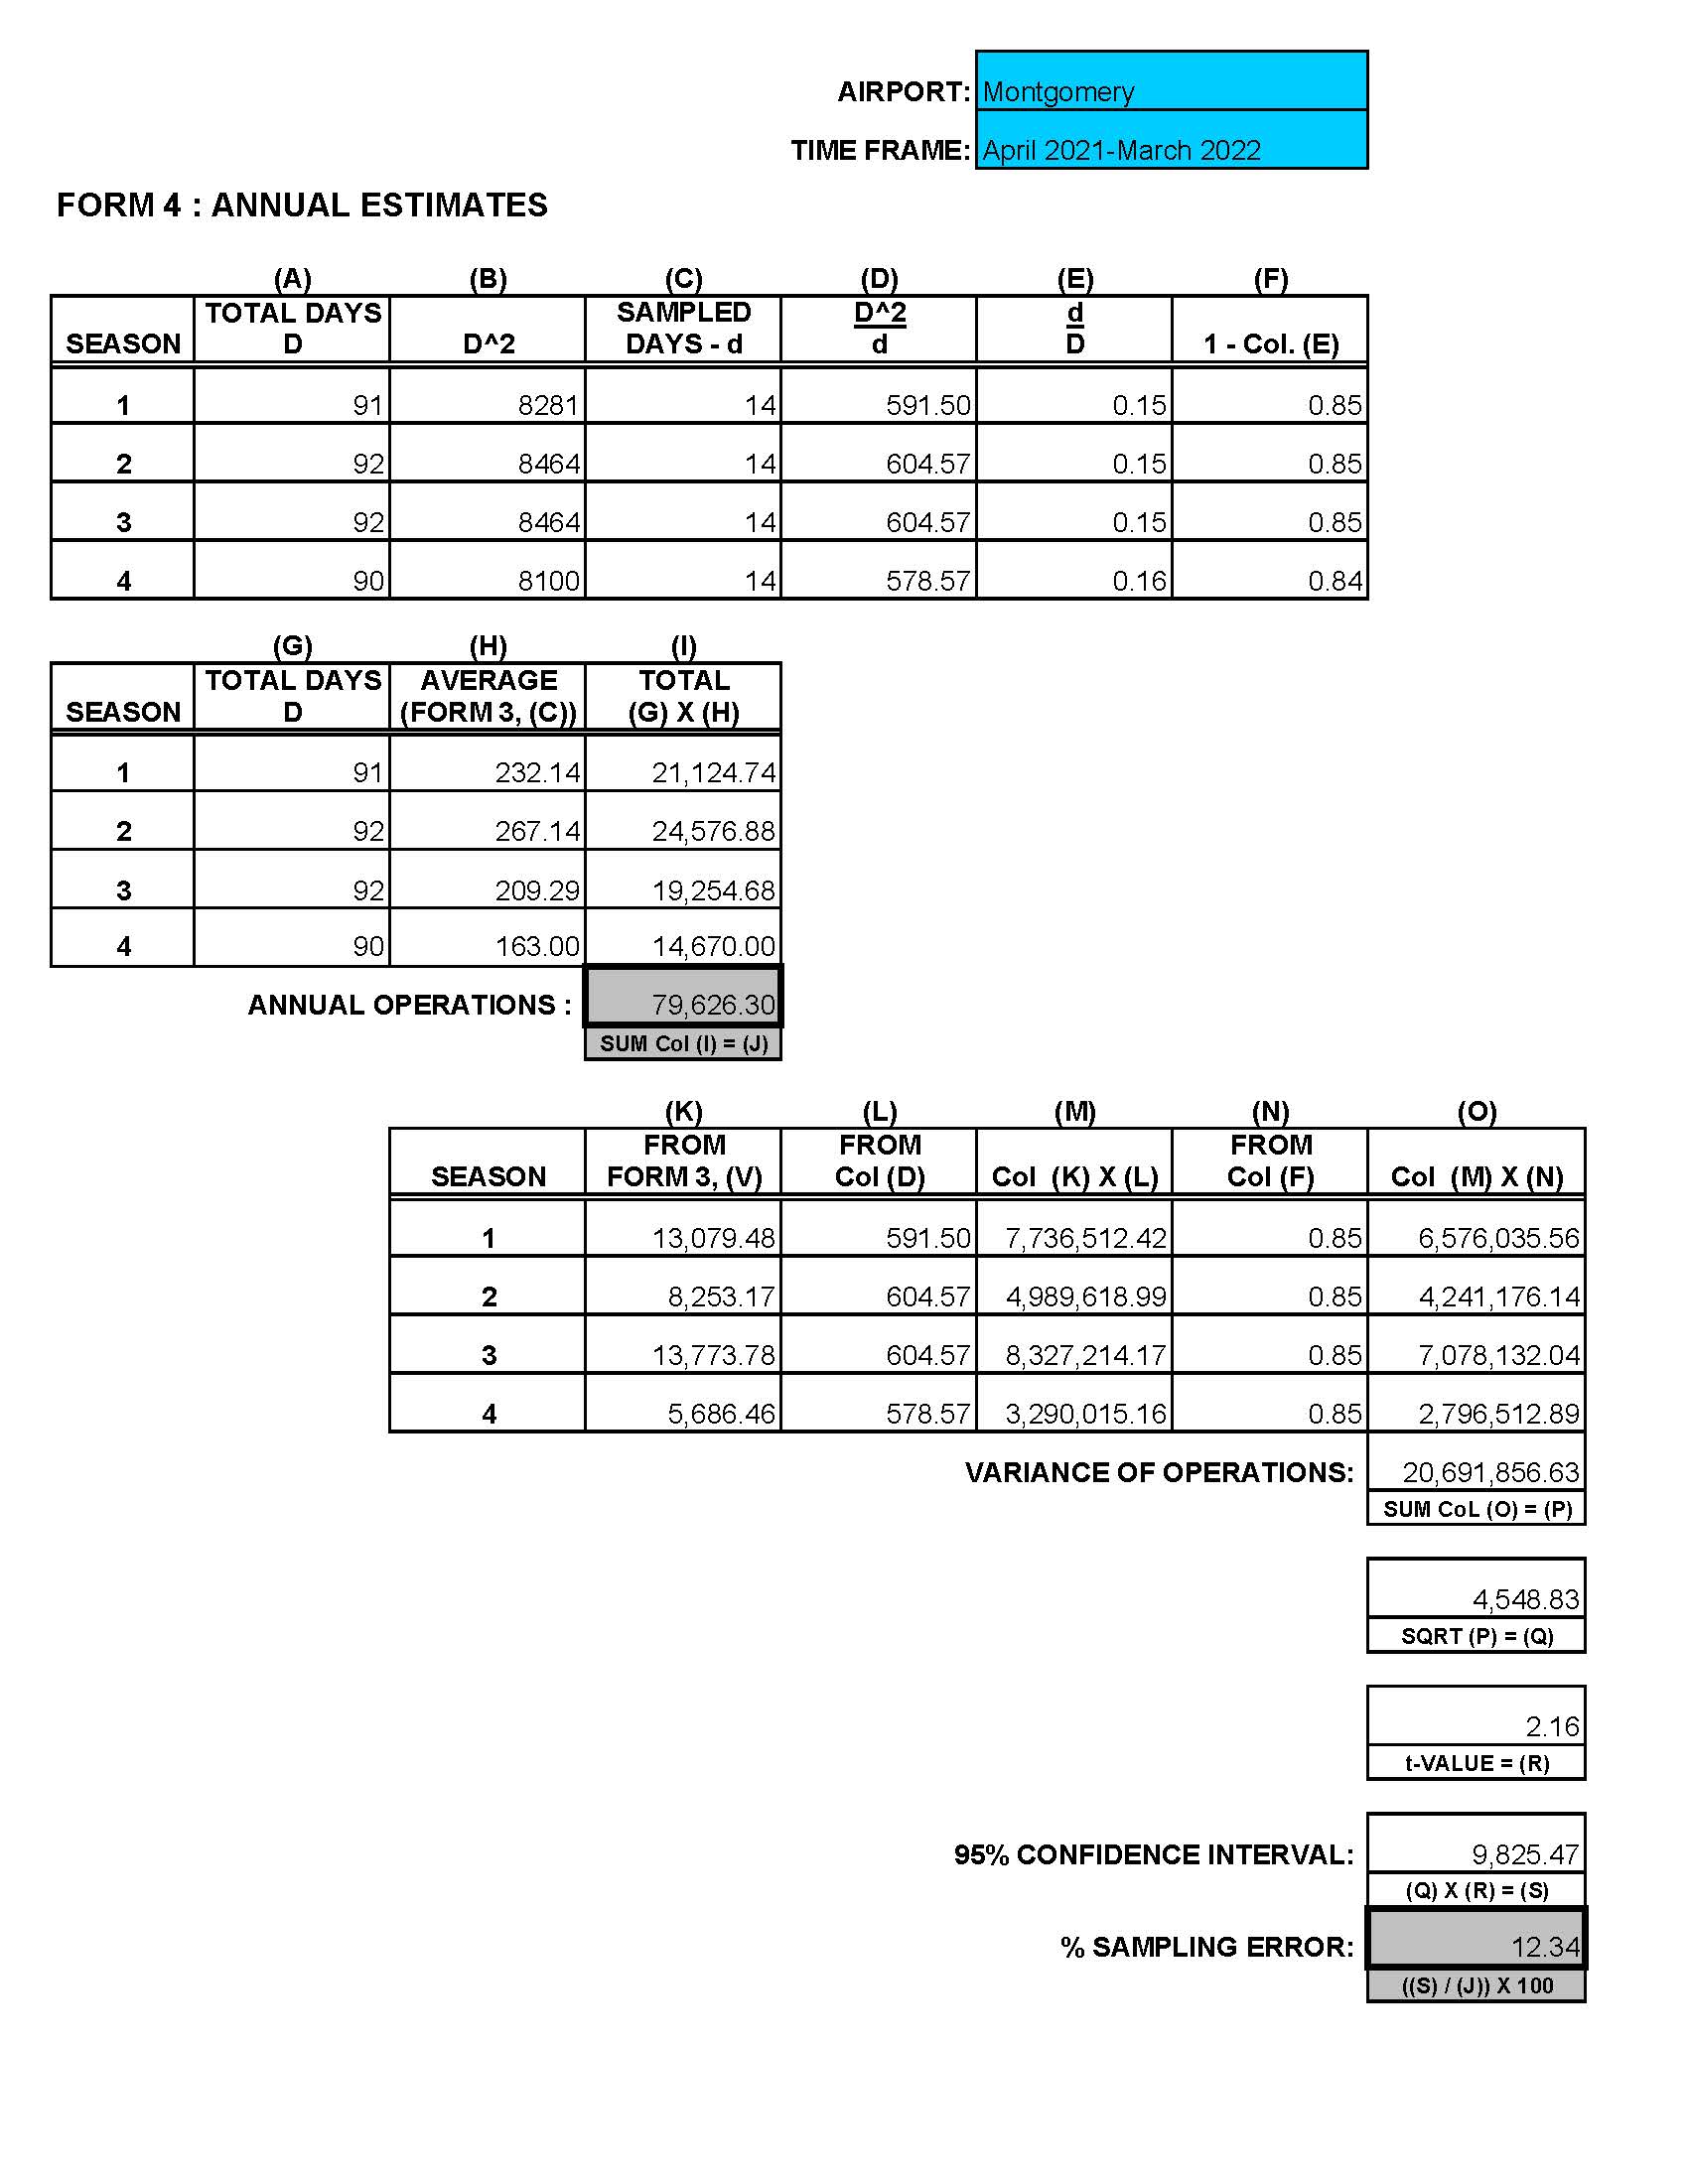
| 2021 | 79,626 |
| 2018 | 67,195 |
| 2017 | 74,134 |
| 2014 | 48,271 |
| 2010 | 50,152 |
| 2003 | 99,774 |
| 1998 | 140,557 |
| 1990 | 108,328 |
Maryland Aviation Administration
| GAI Based Aircraft Activity Inspection Report | |
|---|---|
| Year | Total Based Aircrafts |
| 2023 | 167 |
| 2022 | 155 |
| 2021 | 146 |
| 2020 | 136 |
| 2019 | 135 |
| 2018 | 144 |
| 2017 | 144 |
| 2016 | 151 |
| 2015 | 147 |
| 2014 | 161 |
| 2013 | 160 |
| 2012 | 168 |
| 2011 | 168 |
| 2010 | 168 |
| 2009 | 238 |
| 2008 | 238 |
| 2007 | 238 |
| 2006 | 238 |
| 2005 | 238 |
| 2004 | 238 |
| 2003 | 238 |
| 2002 | 248 |
| 2001 | 248 |
| 2000 | 248 |
| 1999 | 255 |
| 1998 | 241 |
| 1997 | 241 |
| 1996 | 241 |
| 1995 | 241 |
Prior to 2023 data the MAA analysis of operations includes this disclaimer.
"Precision of the annual estimate of operations is measured by the sampling error or 95% confidence interval. The confidence interval is an estimated range (plus and minus the annual operations) with whichone can be 95% confident of the true range of operations. The sampling error is simply the confidence interval expressed in percentage. The annual analysis form identifies the annual operations as well as the sampling error and the 95% confidence interval."